A new analysis of the UK’s buy to let mortgage market shows just how much it’s grown over the past decade, despite the tax and regulatory challenges facing the rental sector.
The Confused .com website says that as of 2022, the total gross advances (new mortgage loans given to borrowers) amounted to £322.5 billion. Of this total, buy-to-let mortgages made up 12.8 per cent.
While that’s significant, most of the mortgage market is still dominated by mortgages for owner-occupied properties – this makes up over three quarters (87.2 per cent).
The actual value of the buy-to-let mortgages equates to approximately £41.3 billion, showing a significant level of investment in buy-to-let.
The size of the buy-to-let mortgage market has steadily increased over the last decade.
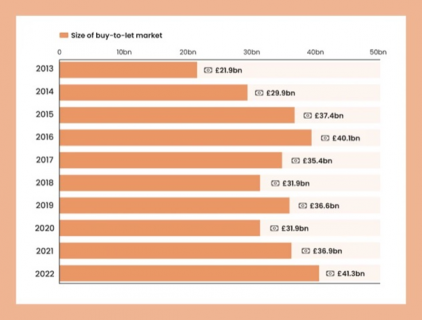
Standing at £21.9 billion in 2013, the buy-to-let market increased steadily before hitting £40.1 billion in 2016.
Confused says this was a busy time for the buy-to-let industry, with high demand as the market bounced back from the 2008 financial crisis.
However, the market saw a downturn in the second half of the decade as the government introduced steps to reduce investment attractiveness in buy-to-let. These included increased Stamp Duty, phasing out mortgage interest relief, and changes to the 10% wear and tear tax allowance. The total size of the buy-to-let market dropped to £35.4 billion in 2017, then shrank to £31.9 billion in 2018.
In 2019, the buy-to-let market rebounded to £36.6 billion, suggesting a resurgence in buy-to-let investments. However, 2020 saw another decline, bringing the market size down to £31.9 billion. This dip was mainly due to the economic impact of the Covid-19 pandemic, which affected investment decisions and the property market more broadly.
The market recovered in 2021 and reached £36.9 billion, continuing to grow into 2022, when it exceeded its previous peak from 2016, reaching £41.3 billion. This reflects a broader bounce-back as the effects of the pandemic eased and investor confidence grew.
|
Year
|
Size of buy-to-let market
|
|
2013
|
£21.9bn
|
|
2014
|
£29.9bn
|
|
2015
|
£37.4bn
|
|
2016
|
£40.1bn
|
|
2017
|
£35.4bn
|
|
2018
|
£31.9bn
|
|
2019
|
£36.6bn
|
|
2020
|
£31.9bn
|
|
2021
|
£36.9bn
|
|
2022
|
£41.3bn
|
Elsewhere in the Confused .com report, and by using a range of government and industry data, plus its own research, the website says England’s investment population is primarily private individuals, representing 93.7 per cent of landlords.
Companies comprise just 4.7 per cent and a mixture of private and companies forms 1.0 per cent.
Some 43 per cent have only one property, while 39.3 per cent have between two and four properties. Landlords with five or more make up less than a fifth of the total.
Most of England’s landlords are aged 55 and above (62.8 per cent). Just 0.1 per cent are 18 to 24 and only 2.2 per cent are 25 to 34.
A total of 52.9 per cent have been landlords for 11 or more years; 38.5 per cent for four to 10 years.
Some 75.1 per cent of landlords’ first rental property purchases were funded with a mortgage.
The largest group of landlords are those who are retired (34.9 per cent) followed by full-time employed (29.7 per cent) and self-employed in roles other than as a landlord (14.6 per cent). Self-employment as a landlord represents 13.5 per cent of the group.
Most landlords (57 per cent) have a buy-to-let mortgage. However, 38.3 per cent have no debt or borrowing.
And the analysis reveals that 15.29 per cent of homes in England are privately rented, with 14.9 per cent in Scotland and 14.0 per cent in both Wales and Northern Ireland.
London is the location with the most rented homes, with 20.81 per cent. The North East of England has the least, with 13.27 per cent.
The complete analysis is lengthy and comprehensive, and can be found here.




.jpg)






Join the conversation
Be the first to comment (please use the comment box below)
Please login to comment